

|
1° 42'03.4 N
7° 24'12.9 E

Everything FAYA publishes comes from somewhere, and every dataset has a point where it stops being reliable. This page says where both of those are.
FAYA measures its work against a results framework built on a theory of change. Results are tracked at three levels: outputs, what the programme delivers; outcomes, what changes as a result; and impacts, the long-term effect on nature and on people.
Wherever a recognised international indicator exists, FAYA uses it rather than inventing one. Indicators are drawn from the IRIS+ Catalogue of Metrics published by the Global Impact Investing Network and from the UN Sustainable Development Goals. Where no standard indicator was precise enough for this programme, FAYA defined its own, and those are marked separately in the framework.
Indicators are disaggregated by gender, age and community where that is relevant.
Member data is recorded during registration, in line with the data protection regulations of São Tomé and Príncipe.
Environmental data comes from three sources:
Coverage is not uniform. It varies by dataset, by location and by year, and layers are revised as new field collection is completed.
FAYA relies on the accuracy of the information provided by people joining the programme, and has not had access to national census data to corroborate it.
Incomes are recorded in bands. The figures used in analysis are the mid-points of those bands and are therefore estimates.
FAYA believes the membership over-represents lower income groups, because the eligibility rules exclude many higher earners who have not lived on Príncipe long enough to qualify.
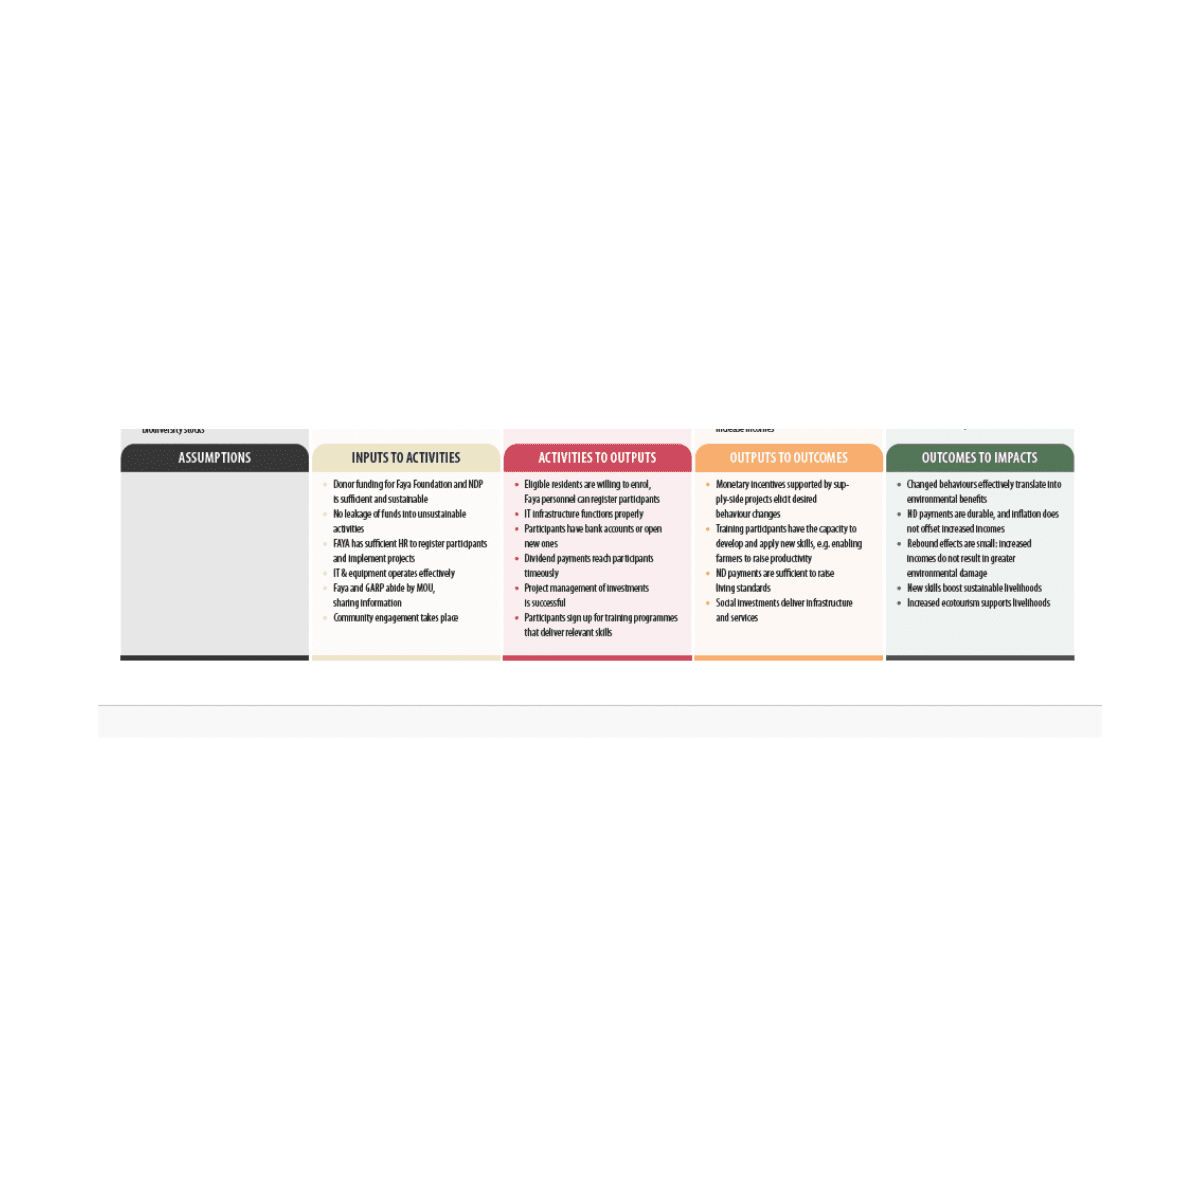
TODO 10xmedia: Assumptions as a responsive web module on Methods & Data Access, directly after „Limits of the data”. Four steps: inputs to activities, activities to outputs, outputs to outcomes, outcomes to impacts. Use the same colour per stage as the Theory of Change module on the Natural Dividend page, so the two are visibly related. Side by side on desktop, stacked on mobile. All text must be real HTML text, not part of an image file.

If you are a researcher, a journalist or an institution and you need a dataset, its metadata or its documentation, write to us. Tell us which dataset, which period and what it is for.
Reports & Publications.
This page is the summary. The full methodology is in the papers behind it.
Sign up for stories, updates, and ways to get involved – straight to your inbox.