

|
1° 42'03.4 N
7° 24'12.9 E

TODO 10xmedia: data ticker. (Mónica: „The information for the data ticker is on the Power BI. We don’t have more.”)
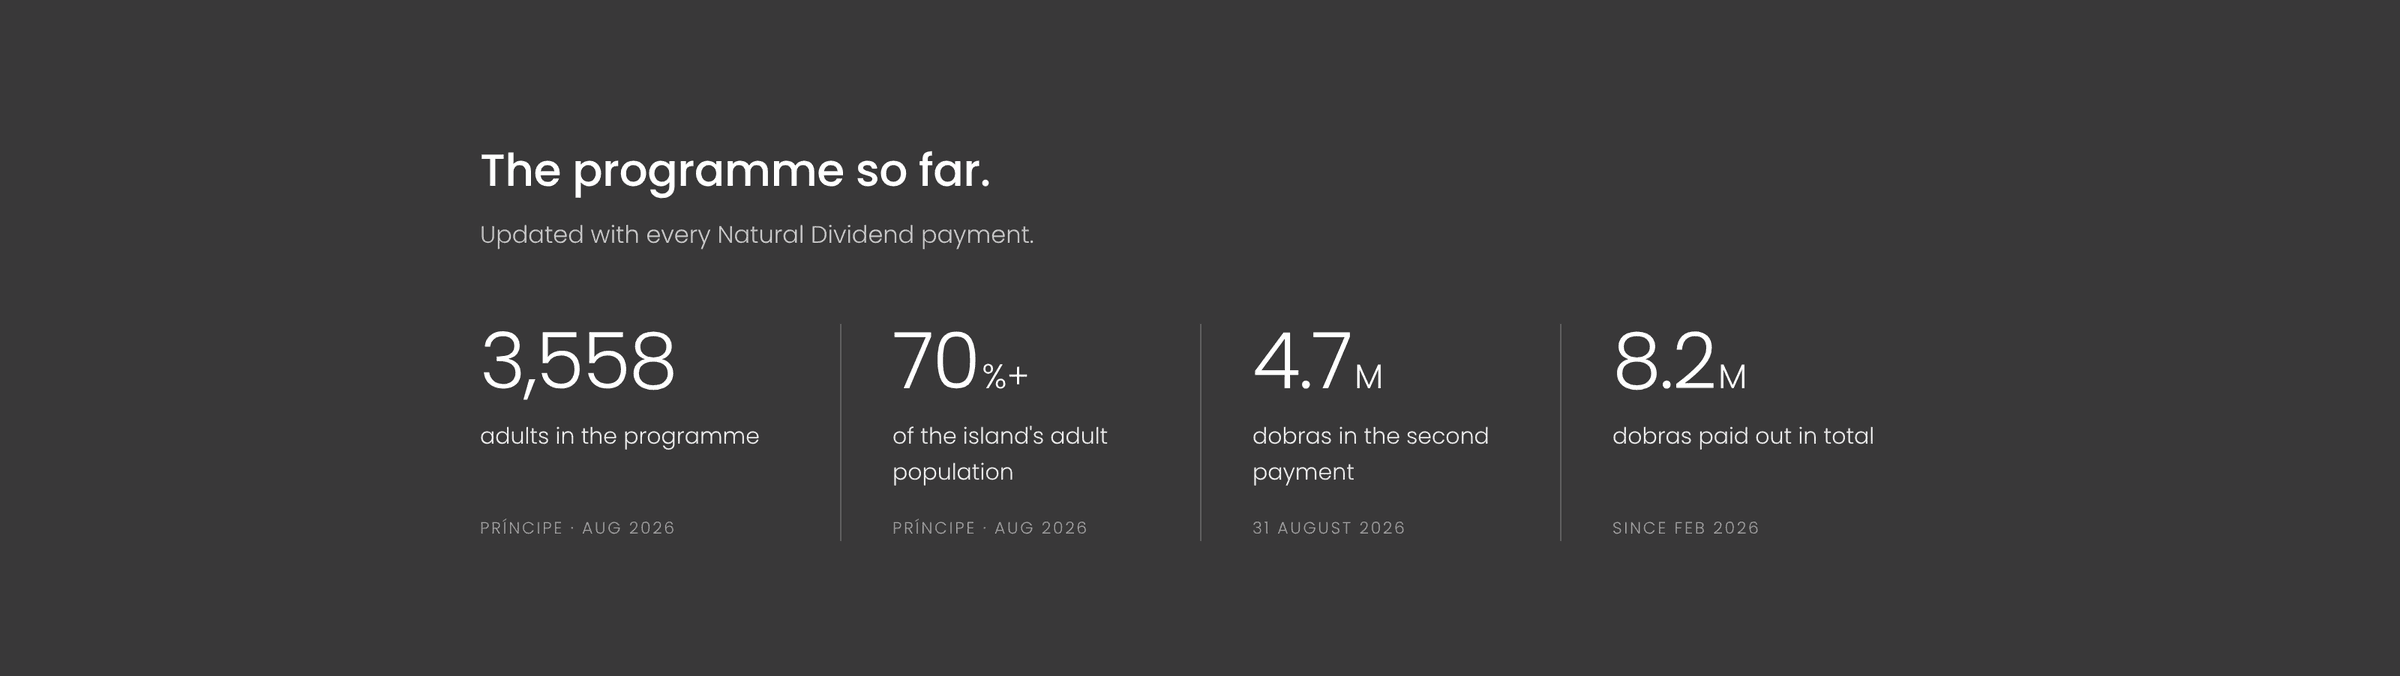

Faya measures what it does. Forest cover and biodiversity are tracked by satellite, by drone and on the ground. Every Natural Dividend payment is recorded and analysed by gender, by location, by employment and by income. The results decide what is paid and what is built next.
All of it is published here. The maps show the island as it is and as it was. The statistics show who receives the dividend and what difference it makes. The reports explain the thinking behind the programme. The methodology explains how the numbers are produced and where their limits are.
If you are a researcher, a journalist or an institution and you need something that is not here, please reach out.
TODO 10xmedia: Please make it look better + add Links by programming different cards here. Inspo in word file.
TODO 10xmedia: latest updates. A short list of the most recent additions across the Research Hub. Pulls automatically from the subpages, not maintained by hand.
Interactive Maps.
Where the data sits on the ground.
Sign up for stories, updates, and ways to get involved – straight to your inbox.